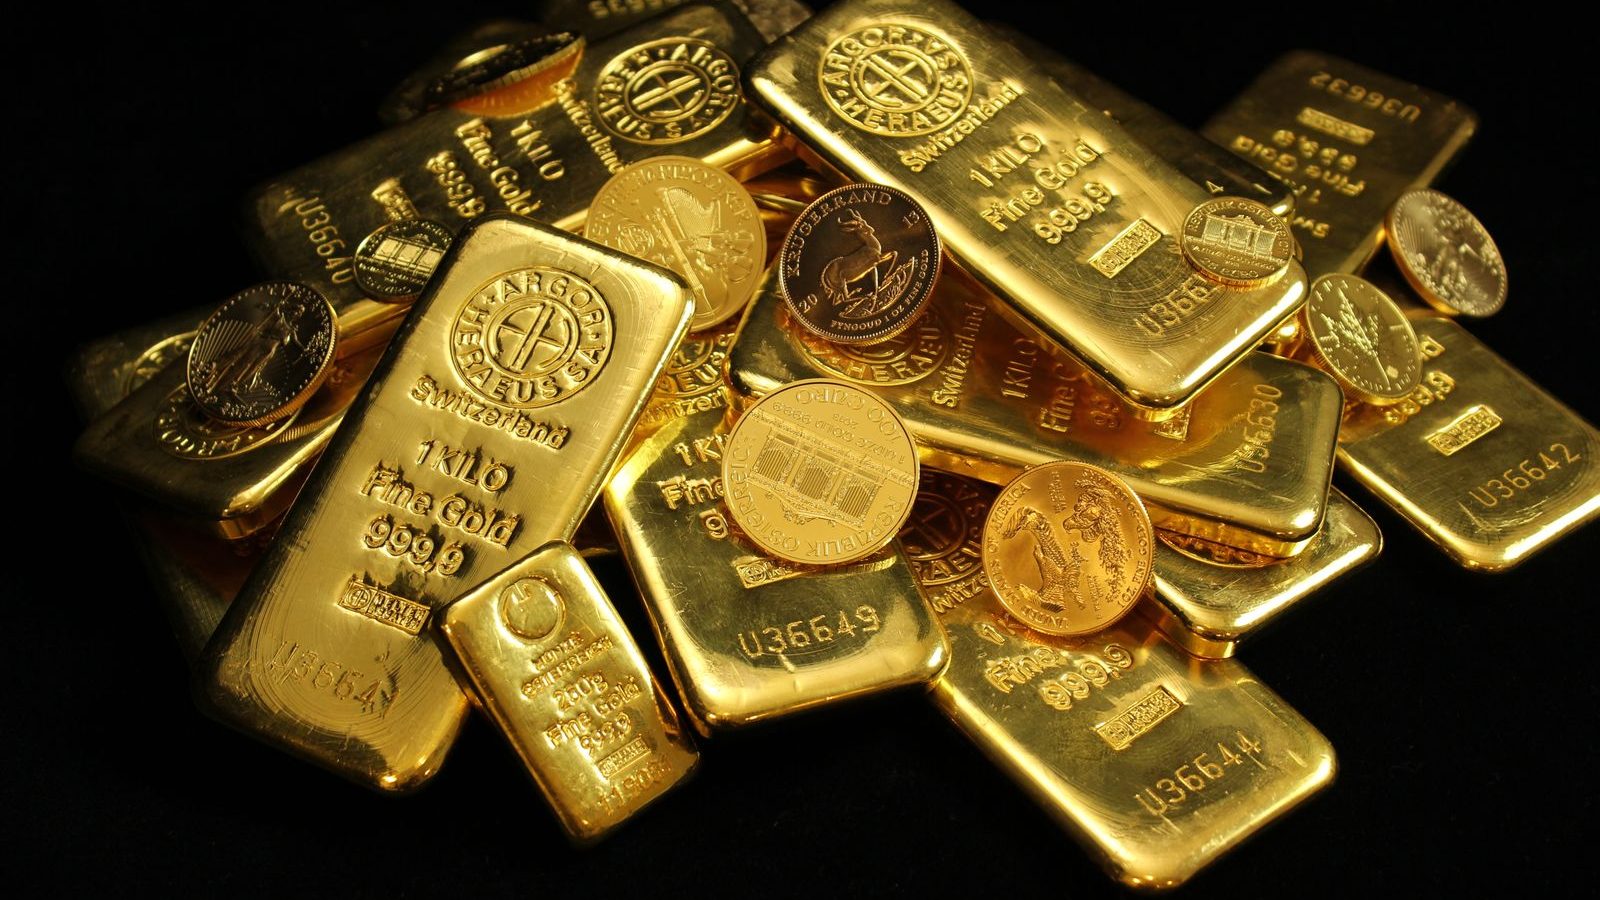
US$4,139.73 an ounce. That was the earlier spot gold quote, up about 0.4%, reported by RTHK at 6.13am on 22 October 2026. The same report said New York gold futures closed at US$4,150, up nearly 0.2%. Overall, spot gold is still hovering above US$4,100 an ounce.
The number itself is easy to remember. The harder question is what role gold should play in a typical household's asset allocation at this level. This article covers general concepts only. It is not buy or sell advice and does not predict the gold price. All prices and data are as of 22 October 2026.
The report gave a price, not a reason
Note that the RTHK report did not explain why gold moved, and it quoted no analyst or official. In other words, there is currently no authoritative explanation for why gold held at a high level that day. What follows covers several factors from recent research. It is background and does not explain that day's move.
Central banks are still buying, but the pace rises and falls
In its quarterly report published on 30 July 2026, the World Gold Council said central banks bought a net 289 tonnes of gold in the second quarter of 2026, 62% more than the 177.9 tonnes in the same quarter of 2025.
Buyers were not evenly spread. The largest buyer that quarter was Poland's central bank, which bought 51 tonnes and 82 tonnes in the first half. The People's Bank of China bought 33 tonnes, its biggest quarterly increase since the fourth quarter of 2023. Russia was the largest seller, reducing holdings by 22 tonnes.
Over a longer period, though, the picture is less one-sided. Central banks' net gold purchases in the first half of 2026 totalled 345 tonnes, the lowest for the period since 2022. Central banks are important buyers, but not an engine that only pushes prices up.
Gold ETF outflows: a weaker gold price, a stronger dollar and higher rate expectations
The same report said global gold exchange-traded funds (ETFs) saw net outflows of about 45 tonnes in the second quarter of 2026. It attributed this to a weaker gold price, and to a stronger US dollar and higher inflation and interest rate expectations in North America.
Gold has not moved up in a straight line either. The average London gold (PM) price in the second quarter was US$4,506.29 an ounce, 8% below the record in the first quarter but still 37% higher than in the second quarter of 2025. Global gold demand that quarter, including over-the-counter trading, was flat year on year at 1,269 tonnes. The first half totalled 2,522 tonnes, with a record value of US$380 billion.
High prices have a cost too. The report said high gold prices weighed on jewellery purchasing power. Demand for gold bars and coins was about 307 tonnes, down 3% year on year, which the report described as a return to more normal levels after two strong quarters.
Safe-haven role: better in market crashes, but not outperforming all the time
A World Gold Council report dated 11 August 2026 said the relationship between gold and equities changes with conditions. In periods of economic growth the two are usually positively correlated, while in risk-off periods the correlation is negative. In two sharp equity sell-offs, the fourth quarter of 2018 and the first quarter of 2020, gold rose 8% and 6% respectively, while the MSCI USA index fell 14% and 20%.
Using a hypothetical portfolio, the report calculated that a 5% gold allocation contributed 28% of the overall diversification benefit. Over 20 years, annualised volatility fell from 11.8% to 11.3% and maximum drawdown narrowed from -41.0% to -38.6%, while annualised return was 7.9% against 7.8%.
Two points to keep in mind when reading these figures. First, the World Gold Council is a gold industry body, so this kind of research has a promotional element. Second, the same report notes that spot gold returned 9.9% from June 2006 to June 2026, but lagged other commodities over shorter periods. It also said most portfolios hold less than 1% in gold.
All called gold, but the risks differ widely by how you hold it
In Hong Kong, the Investor and Financial Education Council (IFEC), through its "Money Wise" (錢家有道) website, sets out the features of several common ways to hold gold.
Physical gold, paper gold and gold ETFs: no leverage
IFEC says physical gold, paper gold and gold ETFs are not traded on margin and have no leverage effect. Leaving aside transaction costs, investors gain or lose as much as the gold price rises or falls.
London gold: leverage magnifies gains and losses
London gold, by contrast, is traded with leverage, which magnifies gains and losses. IFEC gives an example: at 100 times leverage, a 1% fall in price wipes out all the capital, and losses can far exceed the margin paid. IFEC describes the risk as very high and unsuitable for ordinary investors.
Precious metal ETFs: convenient, but with more than one cost and risk
IFEC says precious metal ETFs mainly hold physical metal and track the metal price (after fund expenses), with the metal stored in the custodian's vault. Trading them on the Hong Kong Stock Exchange involves the following costs:
- Brokerage commission
- SFC transaction levy
- Exchange trading system fee and trading fee
- Separate fees charged by the ETF itself to the manager, trustee and custodian
IFEC also lists several risks:
- Price of a single metal can be very volatile
- The custodian's insurance may not cover all metals
- Trading prices can be above or below net asset value
- Tracking error
- Passive management, so no defence in a falling market
- Liquidity risk when trading is thin
- The London pricing benchmark is not regulated
- Risk of official institutions selling gold
Takeaways for ordinary households
Taken together, gold looks more like a shock absorber in an asset allocation than a growth engine. It did better in some equity crashes, but can lag in other periods, and its price rises and falls markedly.
What needs deciding first is not whether to buy, but how to hold it and how much volatility you can accept. With unleveraged instruments, and leaving aside transaction costs, gains and losses move in step with the gold price. With leveraged London gold, as IFEC's example shows, a 1% fall at 100 times leverage wipes out all the capital. For investment decisions based on your personal circumstances, consult a licensed professional.
Prices and details correct as of October 2026
This article is general information, not investment, tax or insurance advice. Everyone’s circumstances differ; consult a licensed professional before making decisions.
Sources
- RTHK 香港電台: 金價靠穩 在4100美元以上徘徊 ()
- World Gold Council: Gold Demand Trends: Q2 2026 ()
- World Gold Council: Gold Demand Trends Q2 2026 - Central banks ()
- World Gold Council: Gold Demand Trends (listing page) ()
- World Gold Council: Gold: The most effective commodity investment - 2026 edition ()
- 投資者及理財教育委員會 錢家有道: 倫敦金的槓桿風險 ()
- 投資者及理財教育委員會 錢家有道: 貴金屬 ETF ()
Corrections
Spotted an error? Email support@wedo-search.com